Groei sneller met data
Neem slimmere beslissingen op basis van realtime inzichten in hoe klanten omgaan met uw menu.
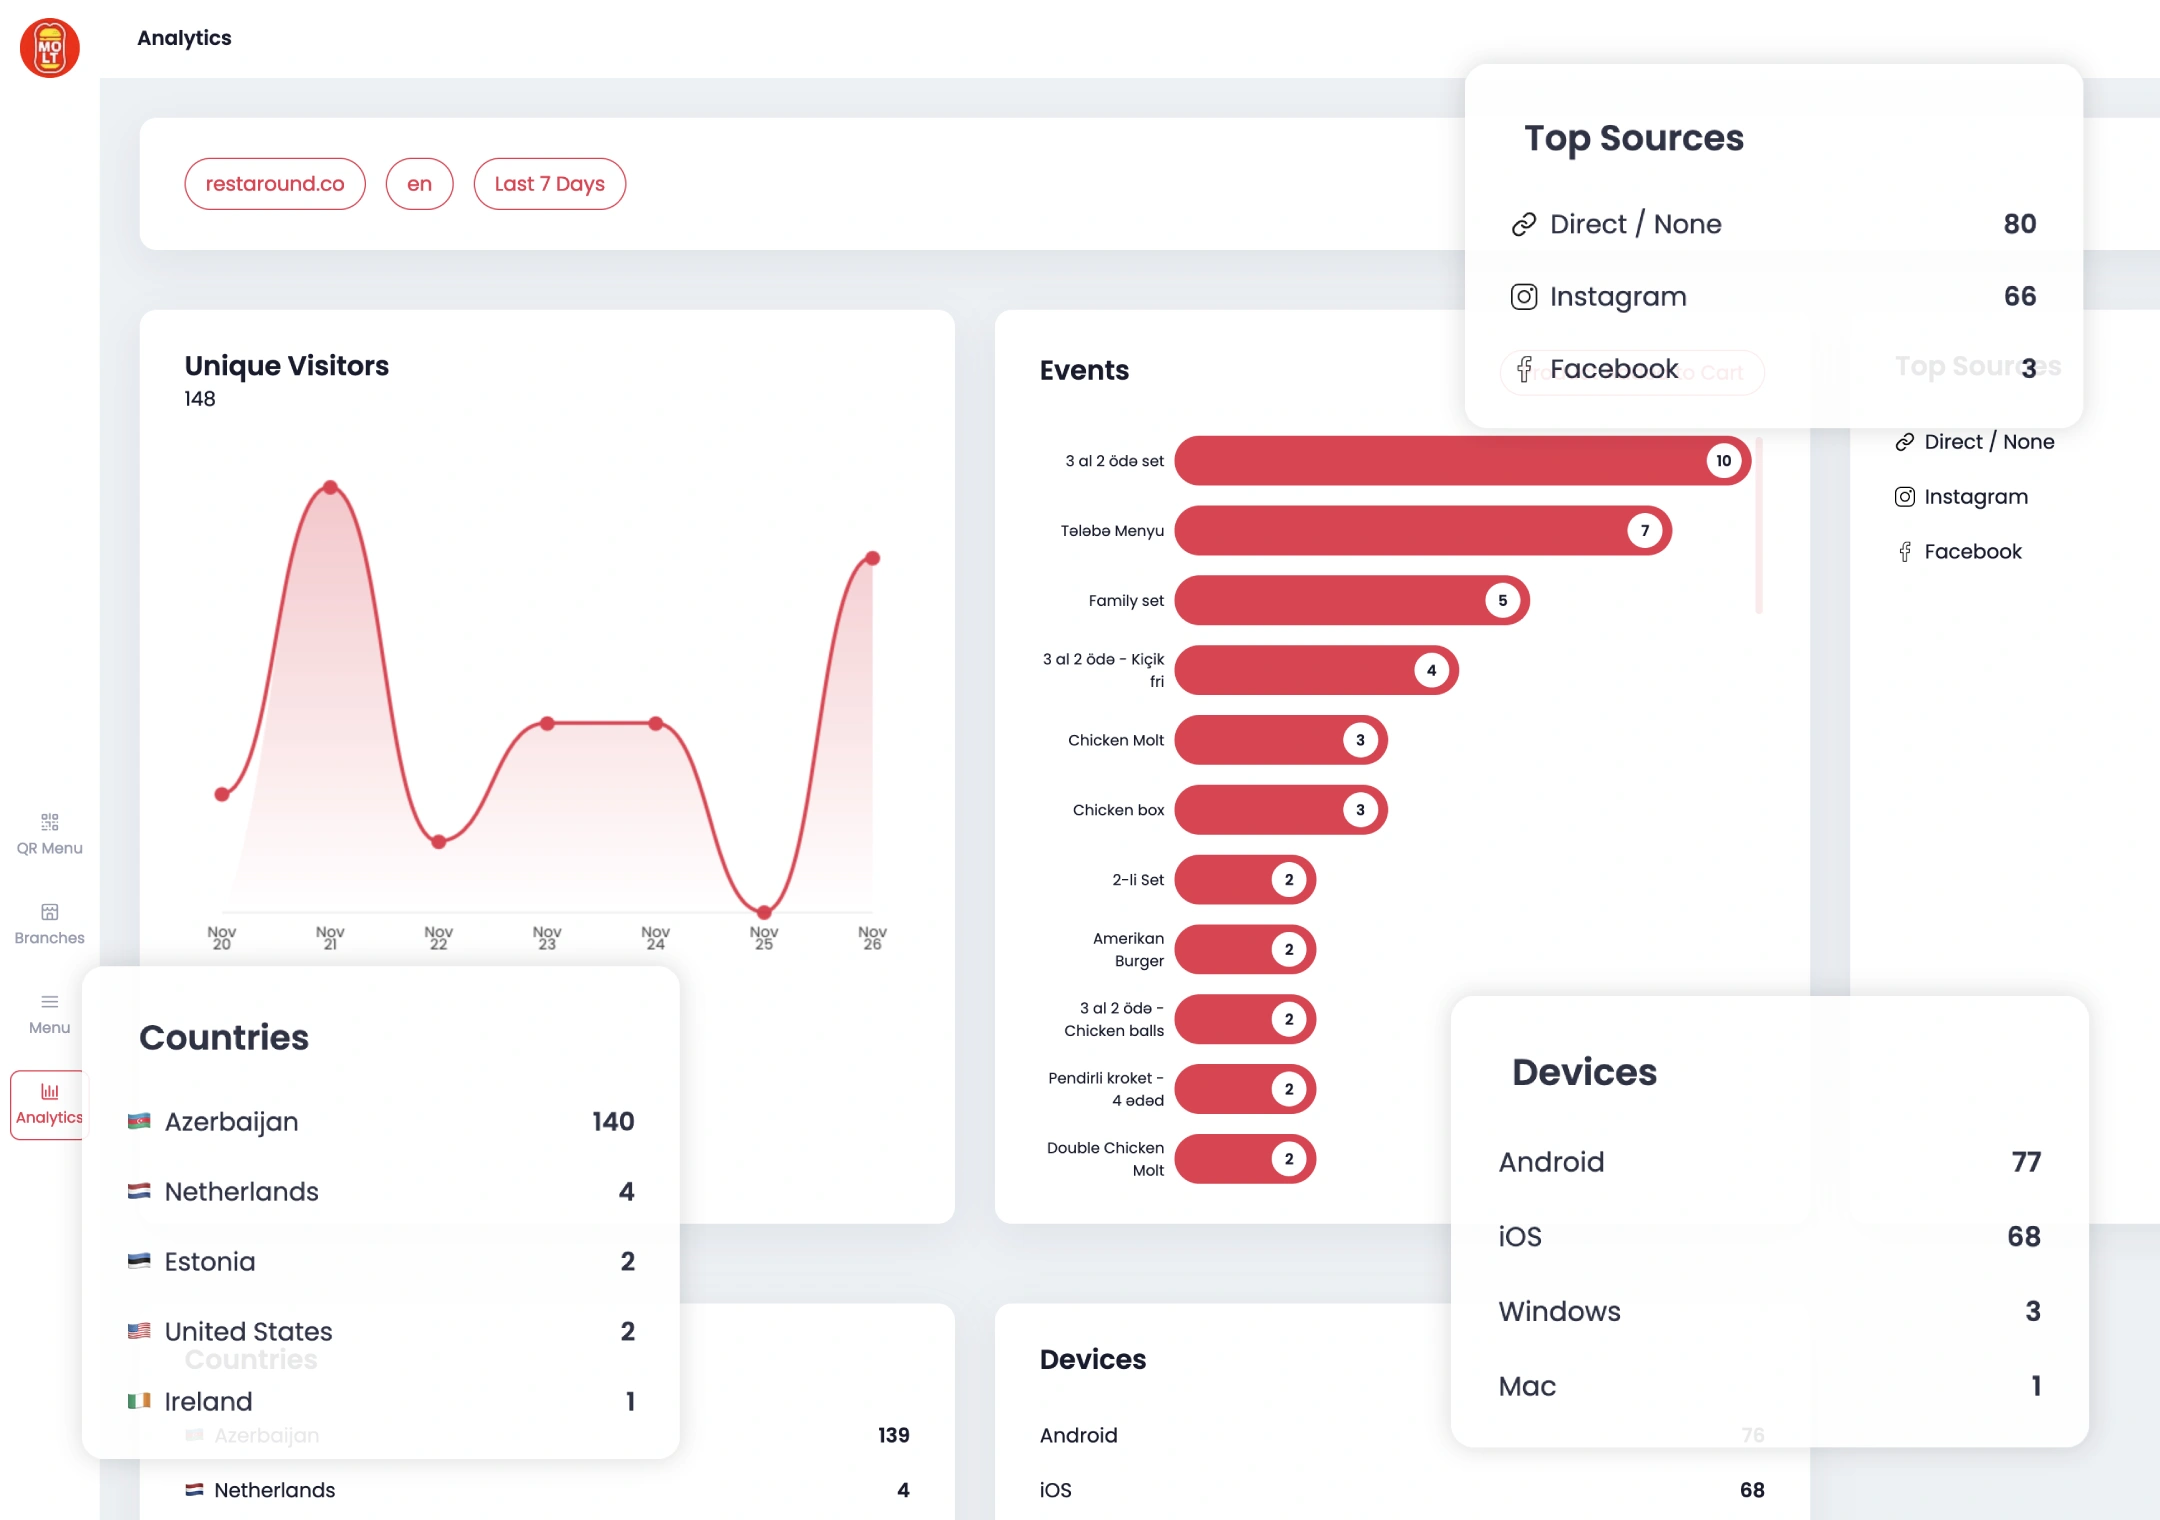
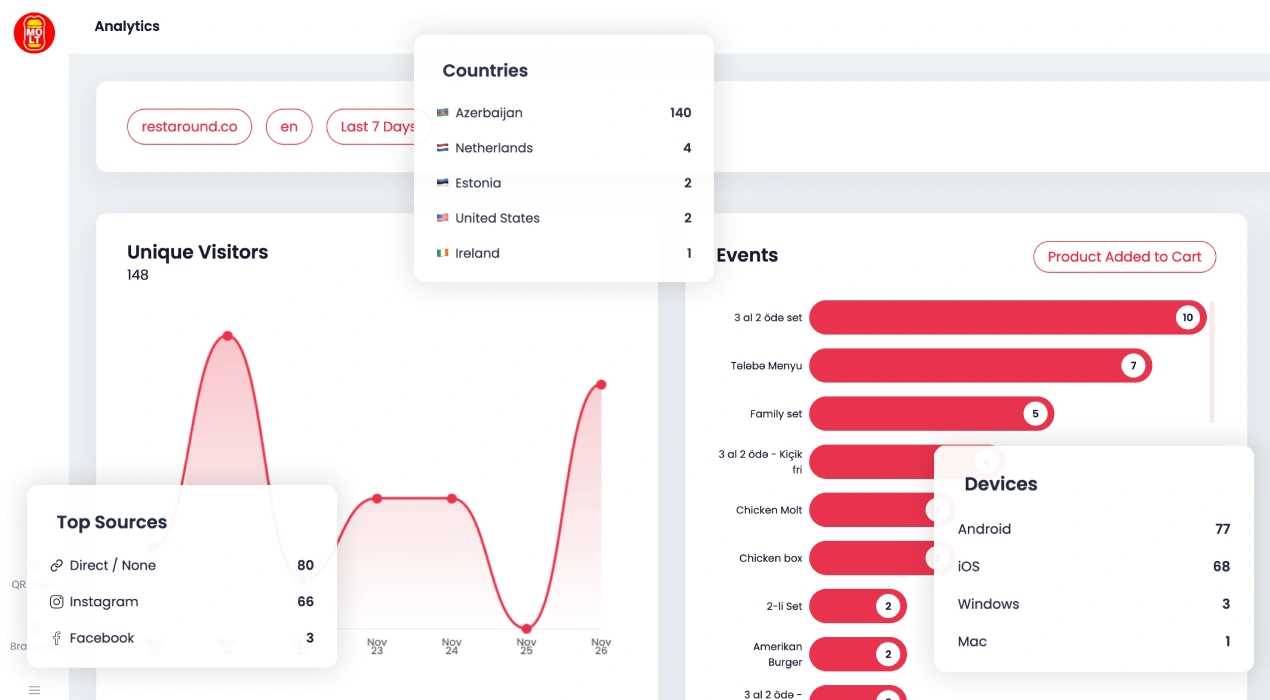
Menu Visitors
Track how many unique visitors view your menu with clear insights. View data on an interactive area chart for today, last 7 days, last 30 days, month to date, last 6 months, last 12 months, year to date, or all time. Understand visitor trends and grow your business with detailed analytics.
Unique Visitors
User Events
Analyze user actions on your menu with detailed event analytics. See actions like viewing product details, adding to cart, selecting categories, and scrolling through. View data on an interactive chart for today, last 7 days, last 30 days, month to date, last 6 months, last 12 months, or all time. Understand user behavior to optimize your menu experience.
Bijgehouden gebeurtenissen
- Productdetails bekijken
- Aan winkelwagen toevoegen
- Categorie selecteren
- Door menu scrollen
- Klik op contactgegevens
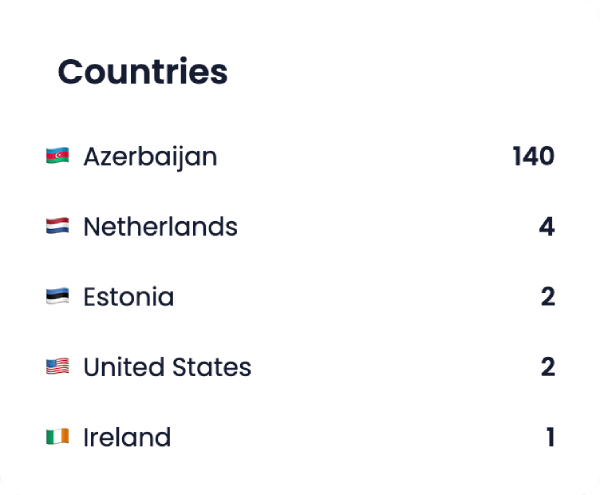
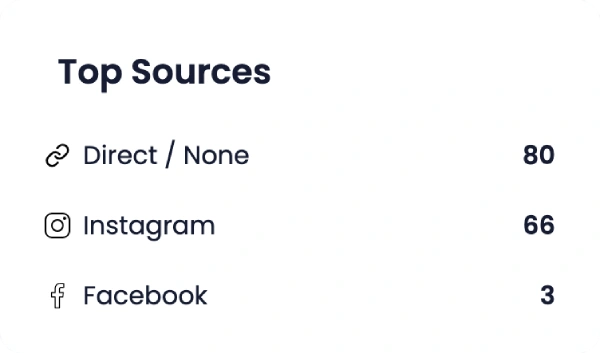
Leer uw publiek kennen
Countries
Top sources
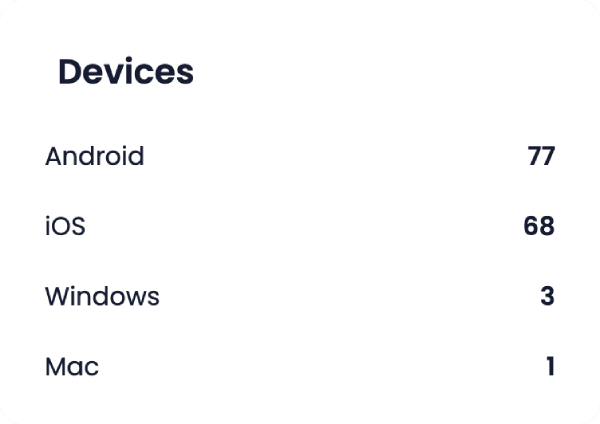
Devices
Veelgestelde vragen
You can track unique visitors, user actions, traffic sources, devices used, and more to understand how people interact with your menu.
User actions like viewing product details, adding products to the cart, selecting categories, and scrolling through categories are all available for tracking in the Analytics feature.
Yes, you can view analytics data for various time periods, such as today, the last 7 days, last 30 days, and other custom ranges.
Visitor data is displayed through easy-to-read charts and lists, showing the number of unique visitors over time.
By understanding user actions, traffic sources, and behavior patterns, you can make data-driven decisions to optimize your menu and marketing strategies.
